MY SYSTEM · STEP 01
How to measure
Three tools, one principle: every swing is a data point. In three years, I've documented 4,063 range swings—laying the groundwork for all subsequent analysis.
„If you want to train measurably, you have to be able to measure measurably.”
As a marathon runner (Berlin 1981, 2:26 h) I learned how important consistent documentation is. In golf, the effect is even more pronounced: a single stroke tells you nothing.
First the 100, 500, 2,000 Repetition creates a pattern. And patterns are the raw material for improvement. I consistently use three tools—one for the range, one for the space, and one for the evaluation.
PDF Manuals
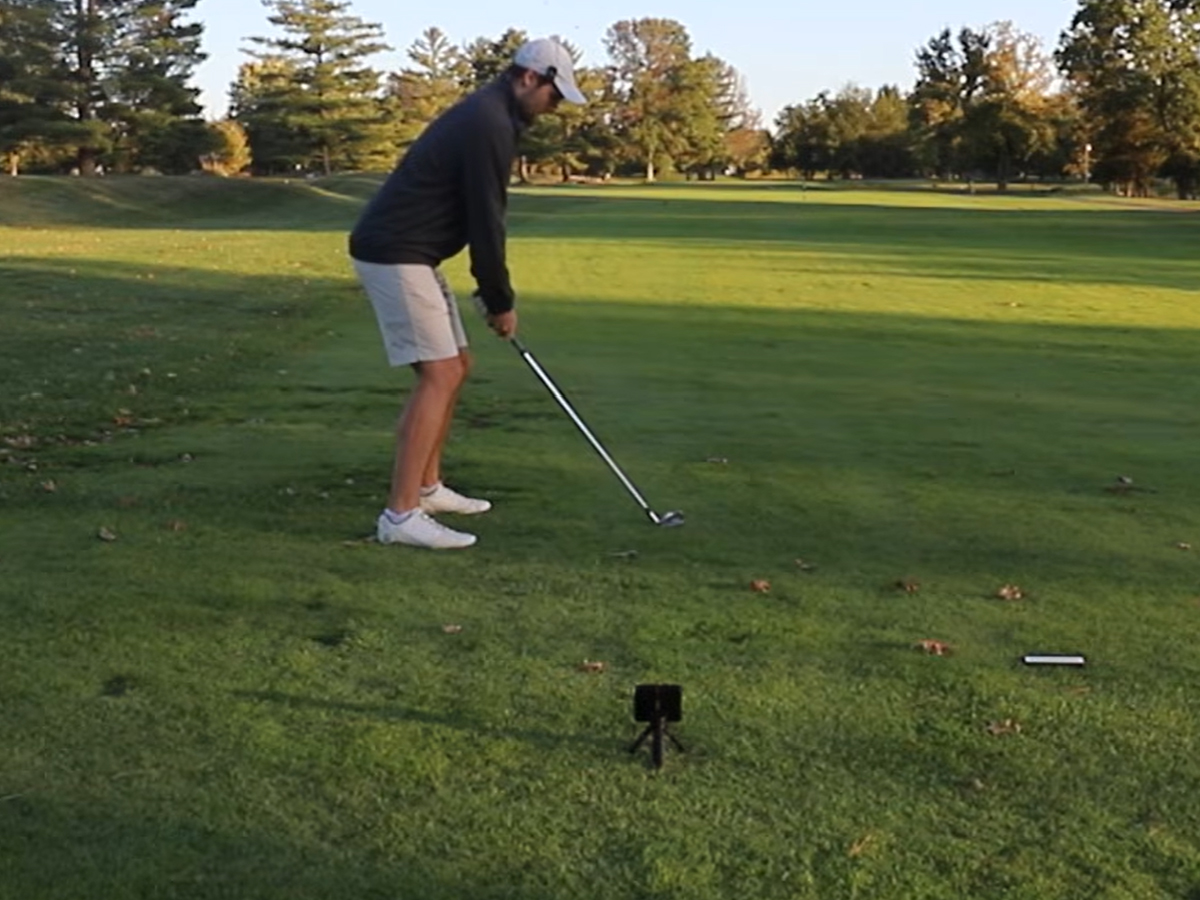
Garmin Approach R10
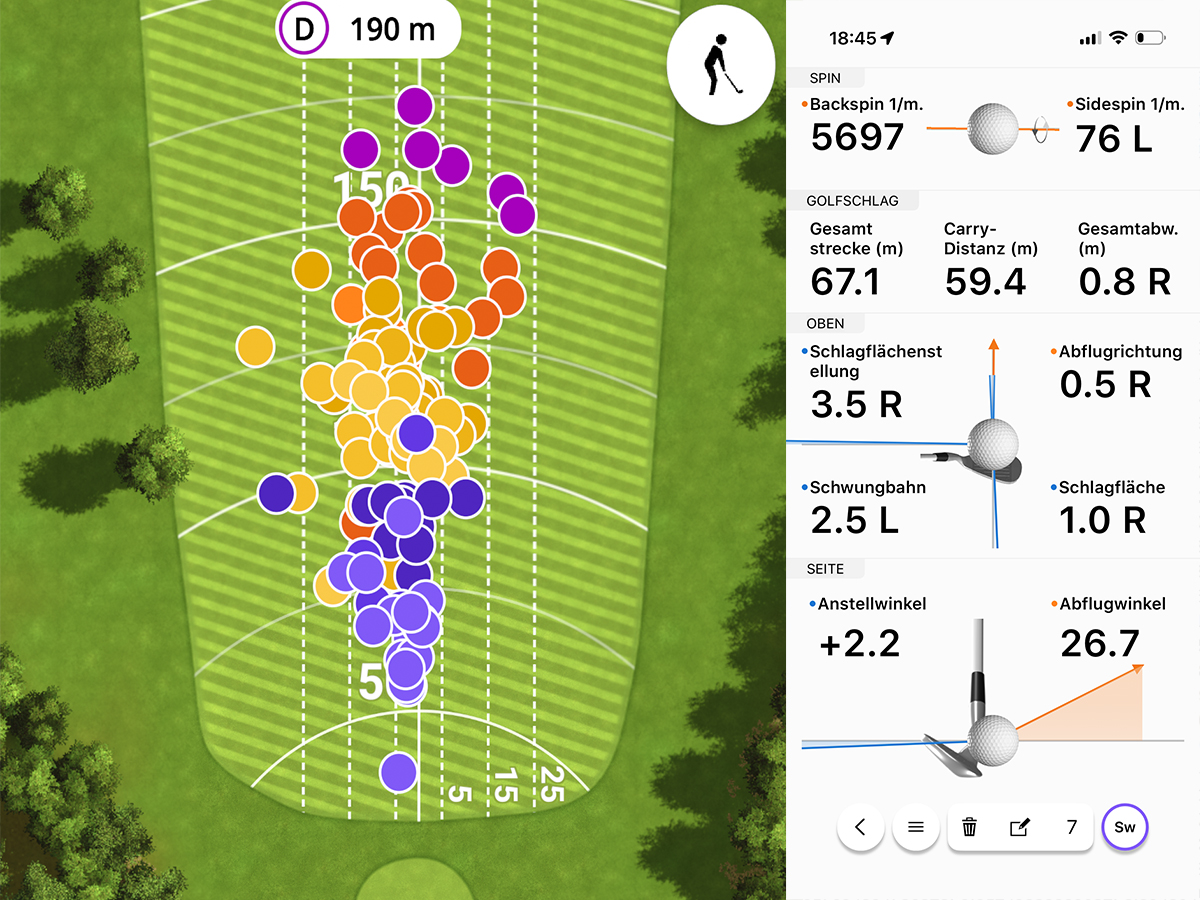
My launch monitor since spring 2023. Every shot is captured: carry, total distance, ball speed, club head speed, spin, swing path, launch angle.
What tour pros paid €8,000 for a Trackman ten years ago, I can get today for under €600. The data isn't exactly tour-level — but it's precise enough to make trends visible over thousands of shots.
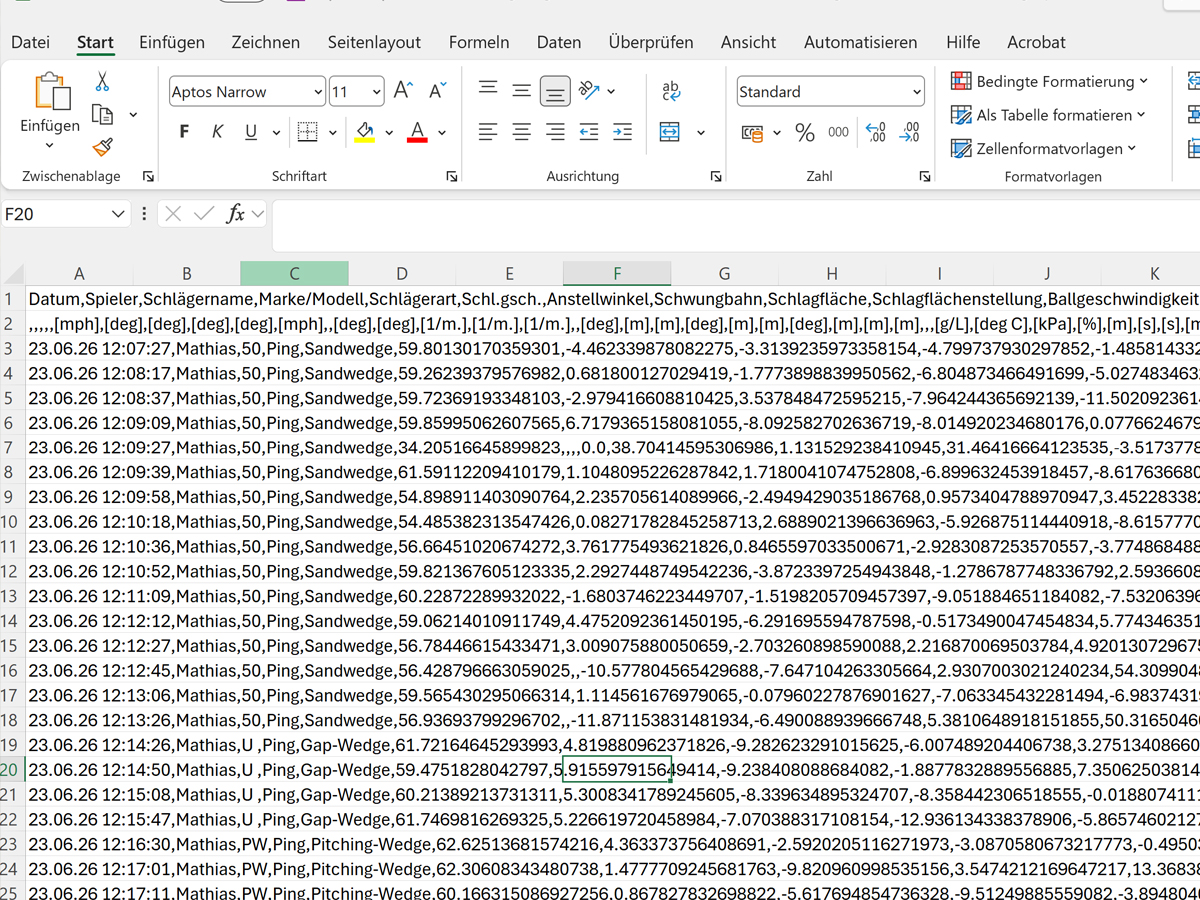
R10 on tripod, app on iPad (instead of smartphone - larger screen). Before each shot: correct club selected. After each range session: data exported as CSV to my Excel.
Bebrassie GPS Tracking
The range shows me how I theoretically hit. The course shows me how I do it actually Tuesday — under pressure, in the wind, with the last hole in mind.
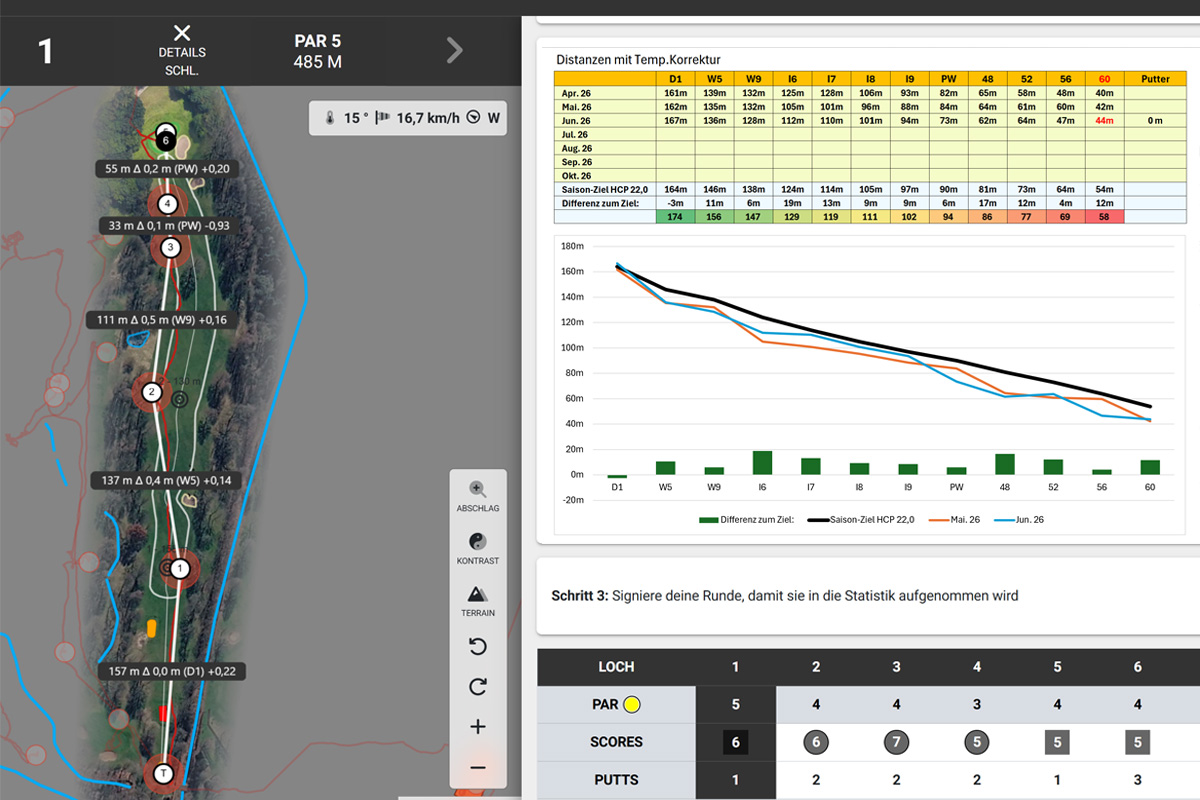
Bebrassie runs on a smartphone in a buggy or on a trolley. Each stroke is recorded by GPS: previous position, subsequent position, chosen club, distance. After the round, I not only have the score, but 54 documented blows (Example Wendlohe Course C, 06/12/2026).
Range data and course data often tell different stories. On the range, I hit my PW 90 meters with a standard deviation of 7 meters. On the course, under pressure, it's more like a standard deviation of 12 meters. Only those who measure both can see the difference – and train both effectively.
Excel as a Central Data Source
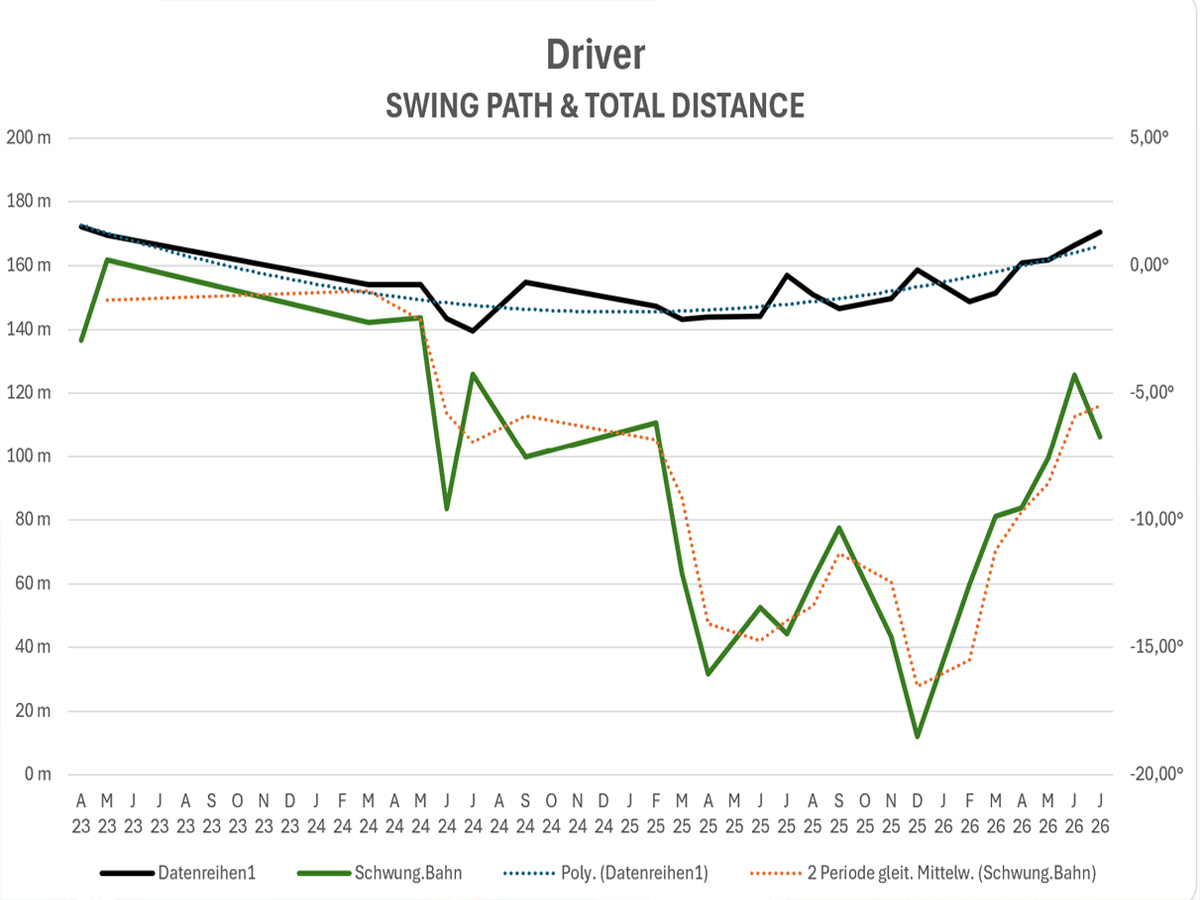
Data from R10, data from Bebrassie, data from performance tests — it all ends up in a single Excel file. Grown over three years, today 50 columns and 4,063 rows.
Why Excel and not a specialized tool? Three reasons: Flexibility (define each column yourself), Property (my data belongs to me, not a cloud provider), AI Compatibility (Claude and ChatGPT understand Excel immediately — see Step 5).
Performance tests with pencil
Not everything can be measured with technology. Some things require pen, paper, and discipline. I'm currently running four performance tests in parallel:
- 3-Circle Putt 30 putts from 3, 6, 9 m. Document success rate.
- P2 - Tour lag: 12 putts from 9/12/15 m. How many remain within the 1-m circle?
- P3 — Lag Putter Length: Distance calibration for long putts.
- P4 — Hole-Out 15 m: How many putts do I need on average?
I repeat these tests every 4-6 weeks under identical conditions. This is the only way I can see if I'm improving – or just feel like I'm improving.
How often and what I measure
2-3 times per week
Each session 60–80 swings with the R10. Focus based on the weekly plan (Driver / Wedges / Irons) — dispersion as the main metric.
Once a week
9 or 18 holes with brassie. Every shot is recorded and analyzed in the evening — Strokes Gained per club and distance.
every 4–6 weeks
Performance tests P1 to P4 under identical conditions. Only through repetition do I see real progress.
What I did wrong at the beginning
Only the good shots count. Beginner's mistake. Anyone who ignores outliers pollutes the database. Median instead of best The most important data rule from 60 onwards is: all hits count, the middle one is the honest truth.
2. Collect data without evaluation. Three weeks of R10 data without looking at it = three weeks wasted. At least one short analysis per week — otherwise the system gets lost.
3. Measure under different conditions. A range session at 25°C with sun is not comparable to 12°C with wind. If you want to see trends, you need to document the conditions (I do this in a „Weather” column) and filter comparisons accordingly.
Three steps for the next two weeks
- Choose a tool. Garmin R10 (~€600) for the range, Bebrassie app (free / Pro €9/month) for the course. That's enough for 90 % insights.
- Document a full range session. Not just the good shots. All of them. Even the topped shots. Even the 5-iron you'd pretty much given up on.
- Transfer to Excel in the evening. CSV export, add a few columns (date, weather, exercise). First data set after 2 weeks - and you recognize the first pattern.
From this initial data set comes step 2 – analysis.
 German
  English